Climate change deniers will often say that climate scientists or oceanographers are exaggerating the amount of sea-level rise. Indeed, they will attempt to have you believe that tide gauges on Pacific islands are instead demonstrating that these islands are sinking. In one instance, they asserted that about 1990, it became obvious that tide gauges on these islands did not agree, so scientists at Flinders University set up modern tide gauges on 12 Pacific islands in 1991. However, deniers assert that there was no change in sea level at any of the 12 sites over the 16 years since the initiation of the project1,2 so the project was supposedly shut down. This has been shown to be a fabrication, as is clear from the idiotic assertion that if scientists don’t get the result they expect, they pack up and go home. That may be how deniers would react, but for scientists, that would simply make things more interesting and more intriguing. The experiment was run by the Australian National Tidal Facility, which used to be run by Flinders University, but was transferred to the National Tidal Centre run by the Bureau of Meteorology (BOM) in 2003. The tide gauges were set up over a period of time with the latest only being installed in 2001. The data obtained was detailed by BOM in their South Pacific Sea Level and Climate Monitoring Project report in 2006 through to 2011 clearly indicating the project was not abandoned in 2007 as the deniers claim2.
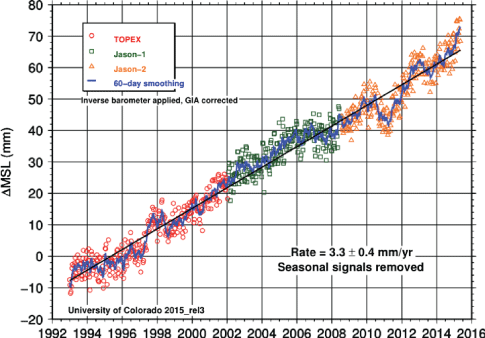
All but the last gauge (which had not been installed for long enough) showed a sea-level rise of the order of 2.8 mm to 7.7 mm per year. Some of these could include a component of subsidence or uplift of the islands. Comparison with another method of measuring sea-level (satellite altimeter) shows that they are largely in agreement, and the West Pacific sea level has risen faster than the global mean (partly related to recent La Niña events). Satellite altimeter measurements of global mean sea-level from 1993 to 2015 are shown in Figure 1. As you can see, the sea-level is rising and the trend is linear. Climate-change deniers tried to maintain at the time that the interval around 2006-2008 represented the end of sea-level rise, but that proved to be like all their other prognostications, just wishful thinking.

Figure 1: Global mean sea-level from TOPEX & Jason Altimetry from 1993 to 2015. From Nerem, R.S. & National Center for Atmospheric Research Staff (Eds). Last modified 19 January, 20163.
Sources


